Eulerian paths with kmers
Using the networkx library for Eulerian path reconstruction and de Bruijn graphs
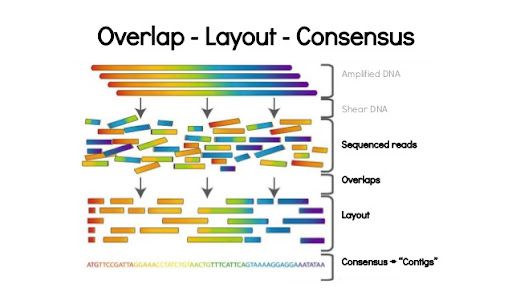
Here is a simple example of unitig generation for sequence assembly using the networkx library. The goal here is to suggest a method to generate contiguous sequences from overlapping genomic reads while minimizing overhead and utilizing the powerful networkx library for a basic component of solving the assembly problem using Python. I will skip the differentiation between overlap-consensus and de Bruijn graph assembly for now and focus on unitig/contig generation using the has_eulerian_path method on a properly constructed networkx.DiGraph.
What is sequence assembly?
For those unfamiliar with sequence assembly, the problem arises when genomic, transcriptomic, or metagenomic sequences are unknown to researchers. DNA sequencing technologies such as Sanger, PacBio, and Illumina sequencing can provide partial answers to a larger problem:
- what is the underlying genomic sequence?
- what are the key features in the DNA that regulate genetic functions?
- coding sequences (CDS)
- open reading frames (ORFs)
- transcription promoter elements
- ribosome binding sites (RBS)
- miRNAs
- how do we describe the reconstruction method?
- how would we assign a confidence level in the reconstruction?
Classical sequence assembly analogy
Now, consider the often-used example of shredding 100 copies of a book, and then trying to reassemble the original text from fragments of the book. By pure chance, you may find some sentence fragments that occur multiple times in the text. But, by shredding the text at non-uniform locations, you may find some fragments with the ends of a sentence with the beginning of a second sentence. When considering all of the overlapping fragments, it can be possible, with enough copies of the book, to reconstruct the underlying text.
Preface to the sequence assembly problem
Building the larger genomic sequence relies on some knowledge of how the smaller building blocks, often referred to as reads, (using the dideoxy Solexa/Illumina parlance, for overlaps that can be considered ‘statistically meaningful’ overlaps by virtue of two metrics:
First, the Phred score Q = 10 log10(P) is used by some sequence assembly software explicitly, or during the data pre-processing, to restrict consideration to high-quality sequence reads, reducing the complexity of sequence assembly due to technical artifacts and low-accuracy DNA base-calls.
Second, a choice of overlap length between reads is often implicitly made, and historically a ‘significant’ overlap is one where the probability of serendipitous overlap is low. This problem is not new to biology, and I’ll use the example of RT-PCR to illustrate some background of the expected frequency of a specific genomic sequence with a fixed length, say ‘k’. The use of sequence primers in human mRNA-targeting qRT-PCR have used lengths of 18-25 base pairs for each primer. Consider a naive example where the odds of two 22-bp primers amplifying an incorrect region in a genome being considerably low, perhaps proportional to the specificity of that 22-bp sequence, which gives a frequency of 1/422 ~ occuring perhaps 1 time in over 17 trillion bases.
This is naive for two reasons. First of which, considers paralogous gene sequences, which are genes that have arisen with more than one copy of a highly similar sequence in the organism due to genetic duplication events followed by further minor mutations that may not effect core common sequences and functions similar between those genes. Second of which, is that genomes do not display uniform preferences for sub-sequences. Some sub-sequences of a genome may be very common, while others may be considerably rare or absent from one organism, but present in another.
How does this relate to networks?
There are two primary methods of sequence assembly, and we will only be discussing de Bruijn graph assembly here. A de Bruijn graph is a directed graph of subsequences of length k (k-mers or k-tuples) connected by edges representing an adjacency in sequence similarity. For example, ACTGAATAT is a ‘left neighbor’ of CTGAATATG, because the k-1 (8-mer) suffix of the first is the same as the k-1 prefix of the second. If the first and second were observed k-mers in a sequencing dataset, and edge could be drawn from the first node to the second.
In this way, a de Bruijn graph can be created for all length-k sequences observed in a dataset. Why is the choice of k important? Well, because for one it can represent some minimum threshold for sequence similarity between reads, in a way that does not require the time consuming process of aligning all pairs of sequence reads to each other. Consider a dataset of 10 million Illumina reads. If certain methods were employed to generate all sequence similarities between the 10 million reads, a considerable number of alignments would need to be produced.
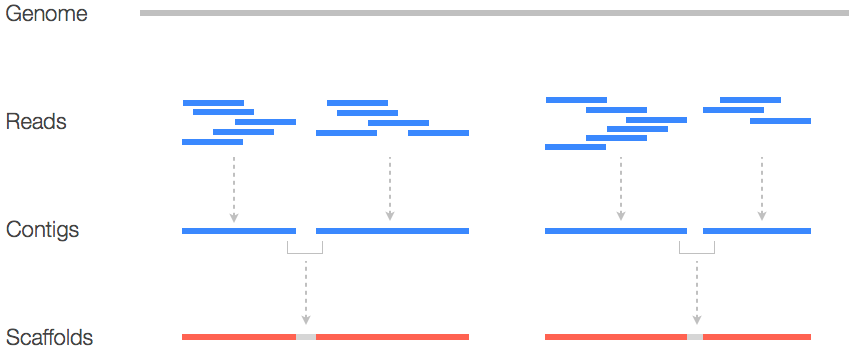
Instead, graph-traversal algorithms are employed to explore a de Bruijn graph and collapse the k-mers and thus the reads into larger contiguous sequences (the ‘contigs’). Let’s explore a trivial example with networkx and kmerdb Python libraries.
Trivial example of Eulerian path
First, let’s construct a simplistic example of a de Bruijn graph using a sequence from Mitogen
First, we’ll download the MAP2K1/MEK1/MKK1 .fasta sequence from Ensembl using this link. We’ll be downloading isoform 1 via Ensembl with transcript ID ‘ENST00000307102.10’ from this gene. This corresponds to UniProt ID ‘Q02750’ and the MANE transcript NM_002755.4.
The sha256 checksum for this dataset is ‘ba45ae394dd2415efb5010cdcc3d7a31c0566f4f4127ad9b9b8d2f837e82651f’ for the sake of it.
Now we’ll generate 50 fold read coverage of this gene with art_illumina. This produces an output file named MEK1.fq with 50 fold read coverage using the default error profile.
1
2
3
# Generate 50x read coverage over the MEK1 transcript
art_illumina -ss HS25 -i ENST00000307102.10.fa -l 150 -f 50 -o MEK1
samtools fastq MEK1_errFree.sam > MEK1.fq
Now, we’ll make sure the reads are coming from the correct strand before loading them into the graph format via kmerdb graph
1
2
3
4
5
6
7
8
9
10
11
12
13
14
15
16
17
18
19
20
21
22
23
24
25
26
27
28
29
30
31
from Bio.SeqRecord import SeqRecord
from Bio import SeqIO

sequences  = []
reads = []
newreads = []

with open("MEK1.fa", 'r') as ifile:
    reader = SeqIO.parse(ifile, "fasta")
    for r in reader:
        sequences.append(r)

with open("MEK1.fq", 'r') as ifile:
    reader = SeqIO.parse(ifile, "fastq")
    for r in reader:
        reads.append(r)

sequence = sequences[0] # Focusing on only the ENST00000307102.10 transcript
# Make sure the reads come from the forward/sense strand
for r in reads:
    if str(r.seq) in sequence:
        reads.append(r)
    elif str(r.seq.reverse_complement()) in sequence:
        newreads.append(SeqRecord(r.seq.reverse_complement(), r.id, r.name, r.description))
    else:
        raise RuntimeError(f"The read {r.id} was not found exactly in the transcript of interest")
# Now print these reads with corrected strandedness to the output file.
with open("MEK1.strand_specific.fq", 'r') as ofile:
    for r in newreads:
        SeqIO.write(r, ofile, "fastq")
Finally, construct the de Bruijn graph via the kmerdb graph command.
1
2
# Generate a .kdbg de Bruijn graph using my PyPI package 'kmerdb'
kmerdb graph -vv --debug --do-not-canonicalize -k 10 MEK1.strand_specific.fq MEK1.10.kdbg
Can we construct an Eulerian path?
The short answer is, yes. With some trivial examples using simple sequences, the Eulerian path along the digraph is possible in Python. The long answer is that given some reads generated on the sense strand of ENST00000307102.10, I’ve loaded the edge list and converted to networkx. However, I’ve noticed that the has_eulerian_path helper does not return a True value when given the edges and nodes in the directed graph. Currently, I don’t have a working method at this point to resolve the assembly problem in a uniform way. I suppose if I had training in graph theory, or had more time to process the dataset of k-mers forming the de Bruijn graph, I could find a simple solution to the problem. In reality, I don’t have the time.
1
2
3
4
5
6
7
8
9
>import networkx as nx
>from kmerdb import graph, kmer
#>from Bio.SeqRecord import SeqRecord

>kdbg = graph.open("MEK1.10.kdbg", 'r', slurp=True)
>G = kdbg.as_networkx()
>nx.has_eulerian_path(G)
False